
WinMTR: A Convenient Tool for Network Diagnostics

MTR is a cross-platform utility for network diagnostics that runs in the terminal. It combines the capabilities of traceroute and ping: like traceroute, it shows the route and all intermediate nodes, but it also calculates in real time the percentage of responses and latency for each hop between your computer and the remote host.
Below, we’ll explain how to use MTR on Windows.
Using MTR on Windows
For Windows, the easiest way to work with MTR is to use WinMTR. The process is straightforward:
- Download the archive and run the program as Administrator.
- If you prefer to see IP addresses instead of hostnames, disable the Resolve names option in the settings.
- In the Host field, enter the website domain or server IP address you want to test.
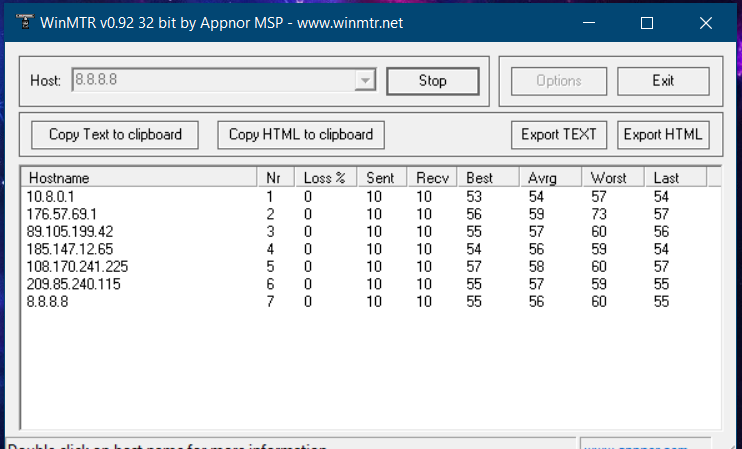
- Click Start to begin the test.
Wait until the Sent counter reaches at least 100. You can stop the test at any time with the Stop button, but the more requests you send, the more accurate the results will be.
When finished, export the report using Export TEXT — this makes it easy to share the results with a specialist.
Key Metrics Explained
- Hostname — the node’s name or its IP address. The message often indicates that ICMP requests are blocked on that node.
- Nr — the hop number in the route.
- Loss% — percentage of lost responses from the host.
- Sent — number of packets sent to the node.
- Recv — number of packets received in reply.
- Best — minimum (fastest) latency.
- Avrg — average latency in milliseconds.
- Worst — maximum (slowest) latency.
- Last — latency of the most recent packet received.
How to Interpret the Results
Focus on consistent issues that appear across multiple destinations. You should pay attention if packet loss reaches around 5% or higher (Loss ≥ 5%), or if the average latency is about 350 ms or more (Avrg ≥ 350).
These metrics help identify where the bottleneck lies — whether it’s with your provider, on a backbone route, or closer to the target server.
Related
All articles
What a 404 Error Means, Why It Happens, and How to Deal With It
A 404 error is one of the basic HTTP status codes. It is most often displayed as “404 Not Found” or “Page Not Found.” The wording makes it seem like something has broken. In practice, that is not necessarily the…

How to Install the Latest Versions of Docker and Docker Compose on Ubuntu and Debian
Docker is no longer just a tool for developers. It’s widely used for test environments, production services, and even small self-hosted projects at home. Docker Compose makes this setup even more convenient: instead of manually running multiple containers, you can…