
mtr on macOS: How to Install and Run Network Diagnostics

mtr (My Traceroute) is a handy utility that combines the functions of ping and traceroute. It allows you to quickly visualize the route packets take to a server, measure latency at each hop, and detect packet loss that causes connection instability.
What mtr Does
mtr sequentially probes all nodes along the route to a destination and displays — in real time — where delays or packet losses occur. This helps you quickly distinguish a local issue from problems with your ISP or a backbone network.
Installing mtr on macOS
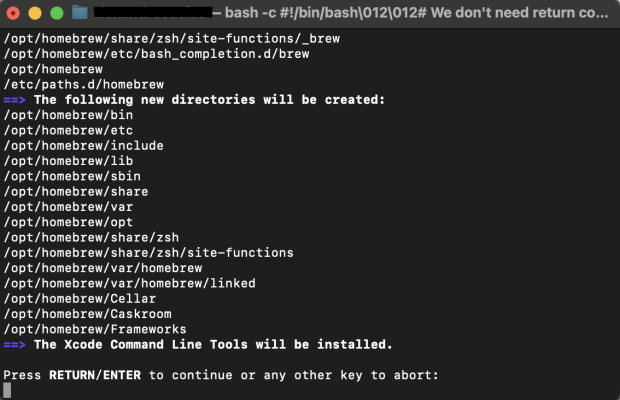
1) Install Homebrew
The Homebrew package manager makes installing mtr simple:
/bin/bash -c "$(curl -fsSL https://raw.githubusercontent.com/Homebrew/install/HEAD/install.sh)"
brew -v
If prompted, enter your administrator password and confirm the installation.
2) Install mtr
Once Homebrew is installed, run:
brew install mtr
Then move the binary files into your system path (administrator rights are required):
sudo cp "$(brew --prefix mtr)/sbin/mtr" /usr/local/bin
sudo cp "$(brew --prefix mtr)/sbin/mtr-packet" /usr/local/bin
After this, mtr will be available from any terminal. Restart the terminal if needed.
Quick Start: Testing the Connection
On macOS, mtr typically requires superuser privileges to run:
sudo mtr <IP_or_domain>
After a few seconds, you’ll see a table displaying all hops and their metrics.
To take a static snapshot instead of live updating results, use report mode:
sudo mtr -r -c 10 example.com
The flag -c 10 tells mtr to send 10 probes to each node and generate a summary report — perfect for attaching to a support ticket.
How to Read the Results
Each row in the table represents a hop (node) along the route, with its statistics:
- Host — hostname or IP address of the node.
- Loss % — percentage of packets lost.
- Snt/Recv — number of packets sent and received.
- Last / Avg / Best / Wrst — last, average, minimum, and maximum latency (in ms).
- StDev — latency variation, showing the connection’s stability.
Consistent packet loss on a specific node or a noticeable increase in Avg or Wrst values compared to nearby hops is a red flag — these are often the network’s weak spots.
Useful Parameters
- -r — report mode (non-interactive).
- -c N — number of packets to send (e.g., -c 10).
- -i X — interval between requests (default: 1 second).
- -4 or -6 — force IPv4 or IPv6 mode.
- -T — send TCP packets (useful for testing services).
-u — send UDP packets (helpful when ICMP is blocked).
Related
All articles
What a 404 Error Means, Why It Happens, and How to Deal With It
A 404 error is one of the basic HTTP status codes. It is most often displayed as “404 Not Found” or “Page Not Found.” The wording makes it seem like something has broken. In practice, that is not necessarily the…

How to Install the Latest Versions of Docker and Docker Compose on Ubuntu and Debian
Docker is no longer just a tool for developers. It’s widely used for test environments, production services, and even small self-hosted projects at home. Docker Compose makes this setup even more convenient: instead of manually running multiple containers, you can…